Create virtual infrastructure maps
Place markers and group them with areas to organize your infrastructure visually for easy monitoring and quick issue detection.
Get real-time visibility into all your systems and devices through intuitive maps and dashboards.
Request demo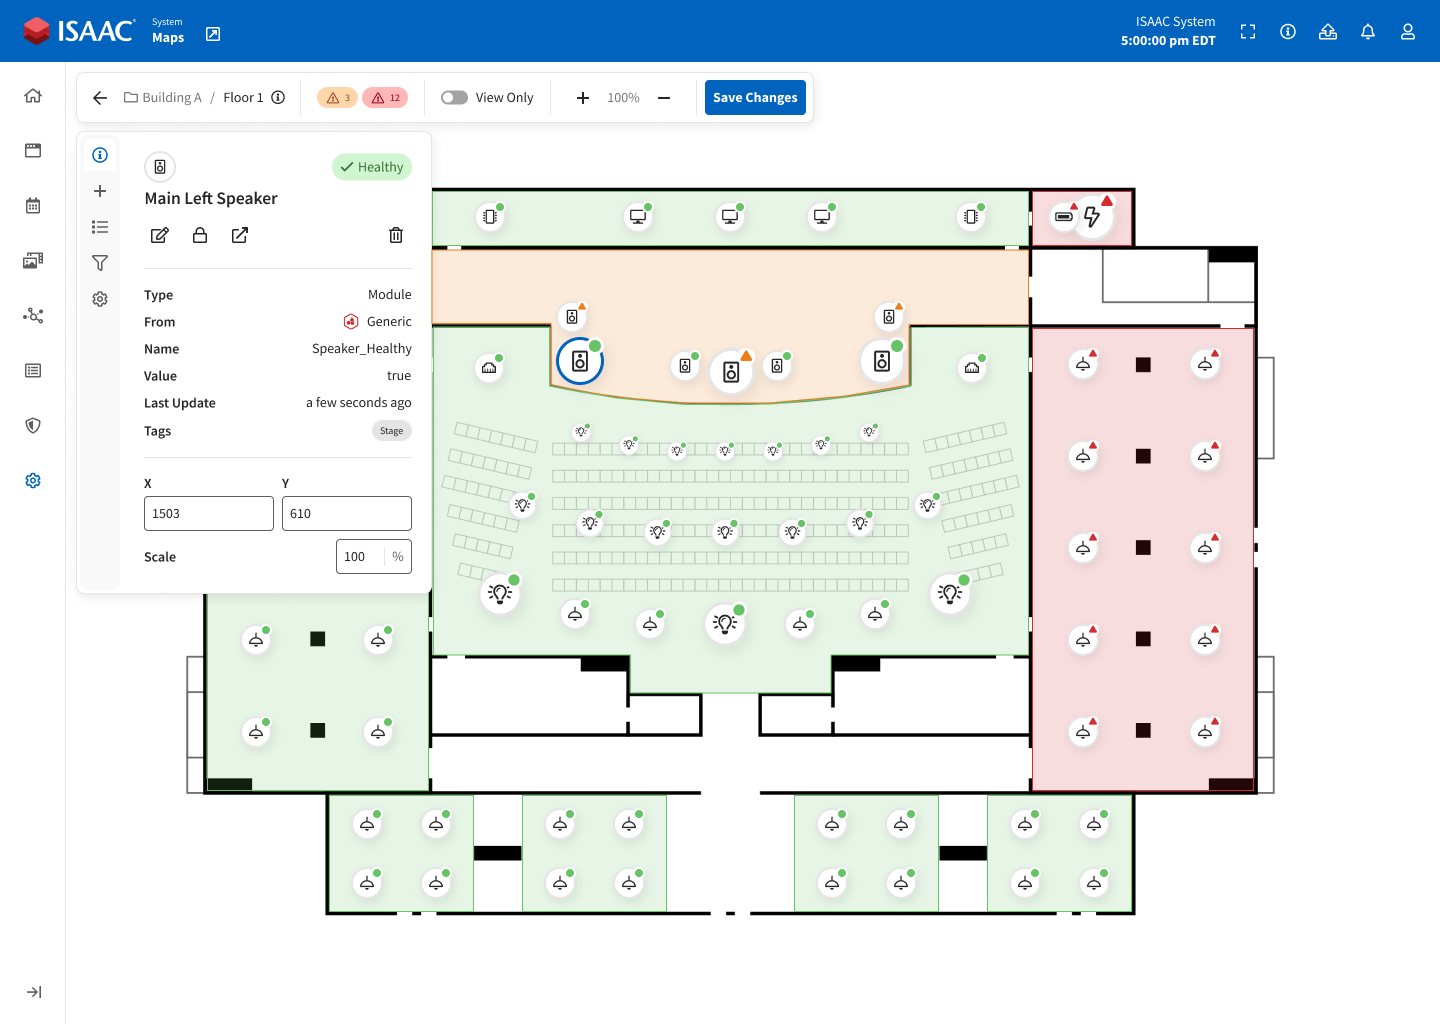
Place markers and group them with areas to organize your infrastructure visually for easy monitoring and quick issue detection.

Simplify troubleshooting with real-time insights and historical data to more easily identify system issues.

Oversee the entire infrastructure platform with tools for VM management, storage, system power, and more.

Place markers to represent devices or variables such as players, lighting, audio, video, or other hardware. Markers show real-time health status and values, and can link directly to dashboards, panels, or other maps.
Group related markers using customizable shapes like rectangles, circles, or draw custom polygons. Areas reflect the combined health state of their contents or can be configured to display the status of a single variable.
Maps are organized with intutive drag and drop in a hierarchical folder structure, making it easy to group locations and systems logically.
Add links for direct navigation to related resources like Panels, Dashboards, or Maps. Configure link behavior to customize your experience.
Areas will automatically aggregate the health states of markers within and show the worst health state for visual alerting.
Markers can be scaled individually or globally to fit your map layout. Useful for emphasizing infrastructure hierarchy or scaling to match map size.
The Asset Dashboard provides a centralized view of all infrastructure assets. Assets with active warnings or errors are automatically brought to the top, helping you quickly identify and address system issues.
Choose which asset details to display and toggle whether assets with active issues should be prioritized at the top of the list.
Search assets by type, name, description, and tags. Advanced filters allow for searching by IP address and external references.
Asset includes a preview graph of historical health state and metric data with a customizable global time range.
Save frequently-used search filters as presets. Presets can be personal or shared with all Workspace users.
Access platform-level details depending on your system. Prelude and Nemesis provide direct control over hosts and VMs. Foundation provides a summarized view of storage usage and system-level statistics.
View all VMs on the system. Expand a VM to see configuration info, resource usage, recent tasks, active alarms, and perform VM related actions.
See active alarms across the platform, including those from hosts, VMs, and datastores. Expand any item to view the specific issue and relevant details.
Shut down hosts and clusters safely using the system power button in the top-right corner.
Take or manage snapshots of VM states. Snapshots save disk state at a point in time and allow reverting to that state later.
View and manage individual ISAAC hosts. Expand to see data, connected VMs, recent activity, and alarms.
See all datastores with disk usage stats, related hosts, and current alarms.
Schedule a demo to see ISAAC in action, ask questions, and learn more about ISAAC.
ISAAC Workspace is not cloud-hosted. It runs fully on-premises with the ISAAC Platform, giving you complete control. Configure it to fit your network and firewall requirements without relying on external infrastructure.
Learn more